Meet Sarah, who runs a popular home cleaning service
Sarah’s business was on pause for growth, but several hurdles were holding her back: her website was outdated, she lacked a WhatsApp presence, her social media and Google Business profiles were not Whatsapp optimised, and she had no solid ai whatsapp marketing strategy in place. This lack of digital engagement led to low enquiries, missed follow-ups, difficulty managing customer communications across multiple devices, and no clear insight into customer interactions.
Initial Challenges: Overcoming Digital Shortcomings and Streamlining Communications
Sarah faced a daunting task: modernising her digital presence and streamlining communication to handle high customer volumes effectively. Without an integrated system, tracking customer interactions and managing follow-ups were challenging, leading to service gaps and missed opportunities.
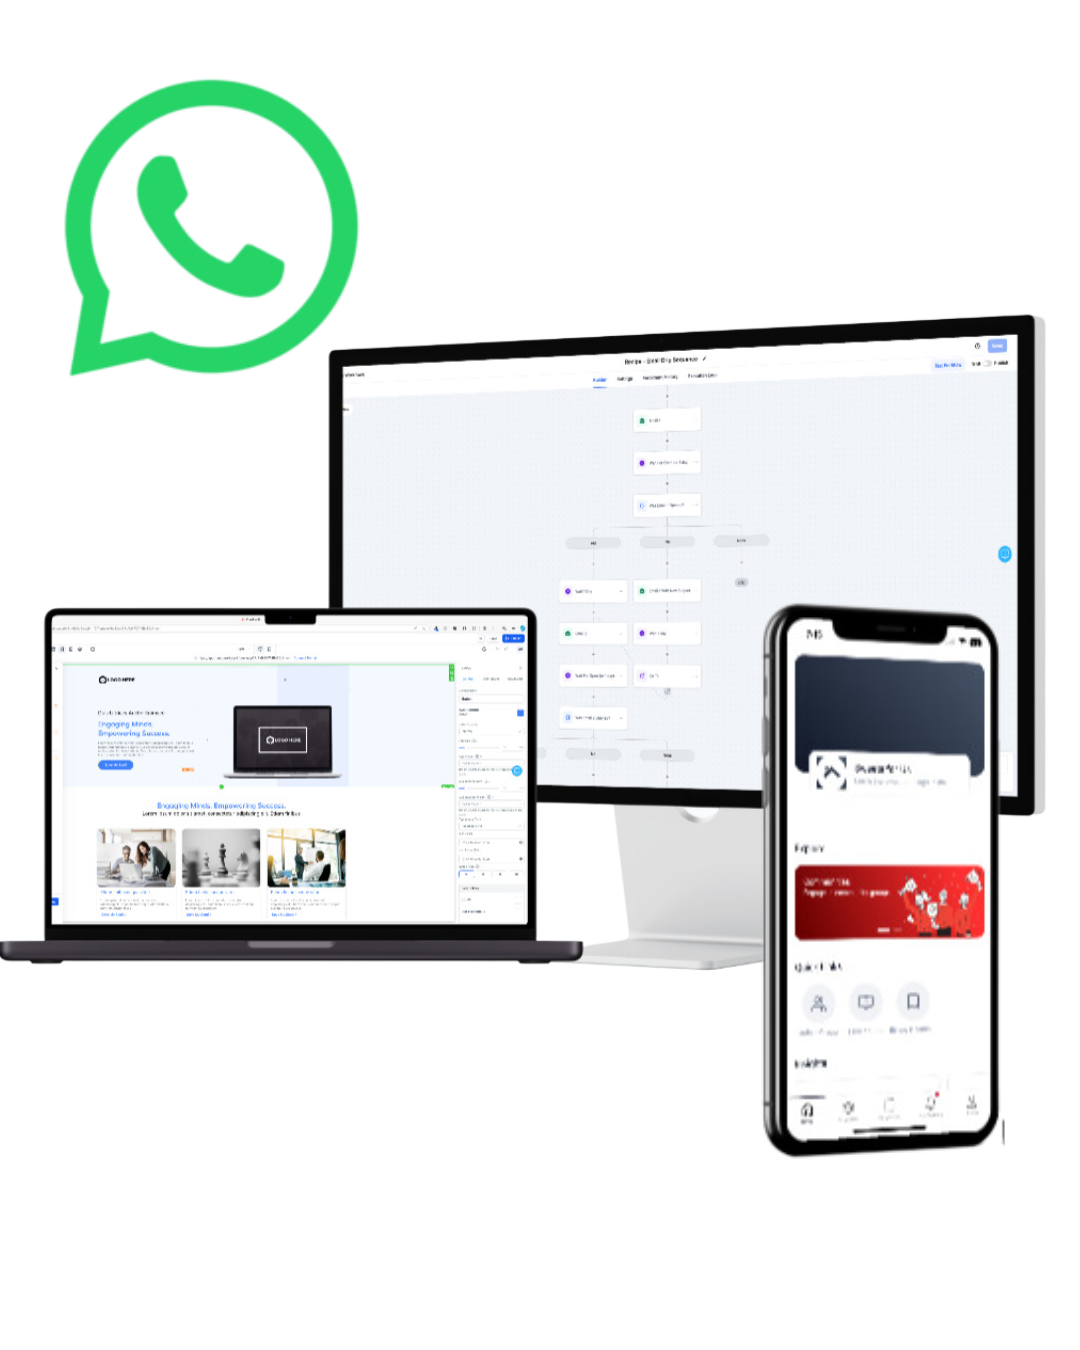
Integrated AI WhatsApp Solution by AI Automated Solutions
Sarah implemented our AI-driven WhatsApp platform, crafted to streamline every aspect of WhatsApp marketing. This comprehensive tool is not just about communication; it’s a robust system for generating leads, automating follow-ups, qualifying potential clients, and providing educational content or answers to inquiries. Additionally, it offers analytics to enhance decision-making, automates review requests, and manages payments—all from a centralized platform.
Features and Benefits:
Lead Generation and Qualification: Our AI-driven WhatsApp platform excels in generating and qualifying leads, automating interactions to swiftly identify and focus on high-potential prospects, boosting conversion efficiency.
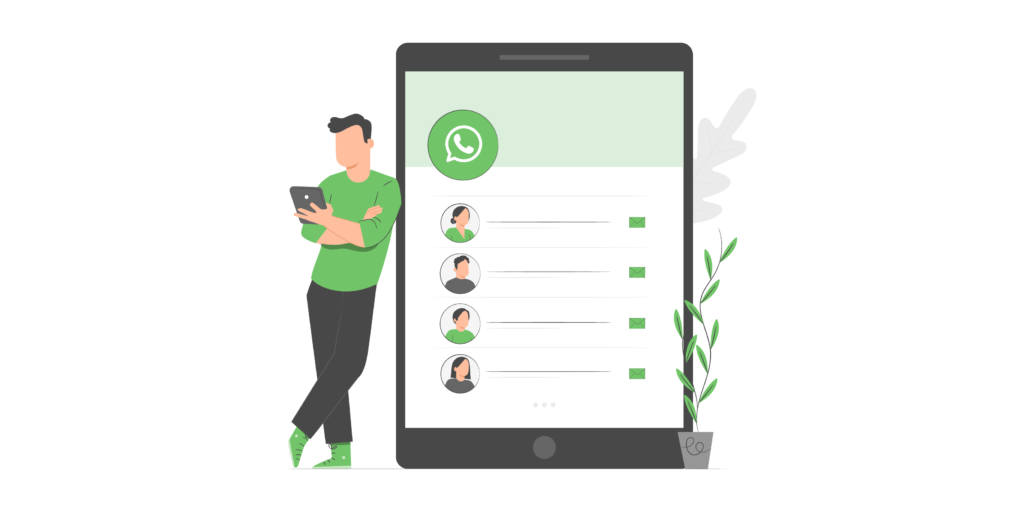
Unified Messaging System: A single WhatsApp number accessible on multiple devices, ensuring no customer query goes unanswered, regardless of who in the team is available.
Automated Customer Interaction: Instant automated greetings and FAQs help address common customer inquiries without manual intervention, ensuring quick and consistent responses.
Advanced Communication Tools: Custom buttons within WhatsApp messages allow customers to easily call, open websites, book appointments, or even navigate to Sarah’s service pages, enhancing user engagement directly from their chat window.
Document Sharing and Confirmations: Automated sharing of quotes and booking confirmations through WhatsApp, improving the efficiency of transactional communications.Real-Time Tracking and Reporting: Detailed tracking of all customer interactions with real data analytics to monitor service effectiveness and customer satisfaction.
Bulk Personalised Messaging: Ability to send bulk messages that are personalized for each recipient, ideal for promotions and updates, maintaining a personal touch.
Automated Follow-Ups and Re-Engagement: Scheduled follow-ups and re-engagement messages keep Sarah’s service top-of-mind for customers, encouraging repeat business and referrals.
After-Hours Service: After-hours auto-replies ensure customers know their messages have been received and will be addressed first thing when the business reopens.
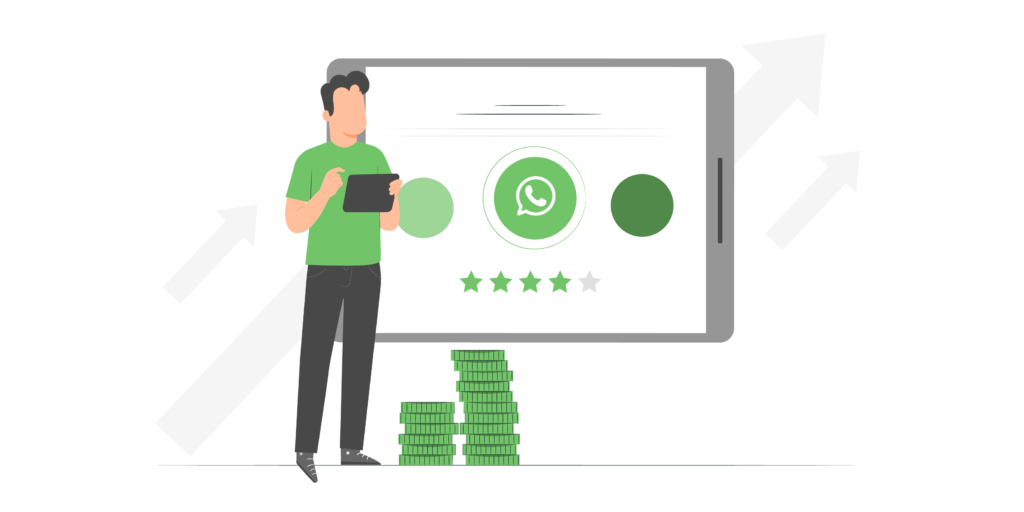
Feedback and Review Solicitations: Automated requests for feedback and reviews post-service help build Sarah’s online reputation and provide valuable customer insights.
The Outcome: A Revitalised Business Model with Enhanced Customer Engagement
With these enhancements, Sarah not only modernised her digital presence but also revolutionised her customer communication strategy. The AI-driven WhatsApp system allowed her to manage high volumes of interactions efficiently, maintain customer relationships with personalised and timely communications, and build a robust database for ongoing marketing efforts.